

🇺🇸 1 Boston Place, Suite 2600, MA 02108
🇬🇧 2 Pear Tree Court, London EC1R 0DS
© 2026, Juro. All rights reserved.

🇺🇸 22 Boston Wharf Rd, Boston, MA 02210
🇬🇧 2 Pear Tree Court, London EC1R 0DS
© 2026, Juro. All rights reserved.
Sales metrics are complex, especially when you’re in a SaaS business. But which of these should sales teams be focussing on and how should you measure each metric?
SaaS stands for Software as a Service and metrics refer to the data that will help you assess how well your business is performing.
Typically, SaaS businesses work through subscription, these businesses scale by enrolling new users and keeping and upgrading existing customers. When chosen correctly, SaaS sales metrics can help underpin your strategy and be a real-time indicator of business help and growth.
Strong metrics can show you a wide range of things about your business, from how you differentiate yourself from your competitors to enabling you to predict customer retention. The latter leads to long-term relationships with customers and, in turn, increased cash flow and growth.
No metric exists in a vacuum, all of the below interact with one another and will help you to build a successful business (and sales function). This doesn’t mean you need to track all nine of these metrics, rather you should use this as a guide.
According to databox, the top five metrics that SaaS sales teams are tracking in their sales dashboards include:
Monthly recurring revenue measures the exact amount of revenue a SaaS company expects to receive monthly. It’s a fairly simple metric, often described as tier one, that measures how many customers you currently have and how much you receive from each of them monthly.
As a formula, this looks like:
MRR = total accounts x average payment per account, calculated each month
This is most useful as a comparison metric, so it’s important to calculate it at the same time each month. MRR gives you a birds-eye view of how successful your sales function is as it effectively tracks all monthly sales, upsells, and churn.
MRR is also an essential measure for predicting and benchmarking growth, with Geckoboard stating that “Startups seeking post-seed/pre-series A funding should target a 15%+ Net MRR Growth Rate (month-over-month).” Although it’s worth noting that an increase in financial pressure on startups, caused by inflation during 2023, may have changed this picture slightly.
A healthy MRR indicates that you’re focused on generating scalable and consistent revenue which will continue to boost your monthly cash flow. It’s also a metric that is important to the C-Suite and the board, as they may ask:
In addition, comparing your current MRR to your sales pipeline can also help you to predict where you are headed in the future.
This metric refers to the number of customers that do not renew their contract with your business and ‘churn’. Churn rate specifically measures your loss in subscribers for a given period.
As a calculation, this looks like:
Churn rate = (# customers canceling / total # of customers) x 100
This metric can tell you a lot about the current status of your business and product. Churn is affected by every single aspect of your business, from how marketing sets expectations to how customer success deals with queries and issues. If churn rates begin to rise, you need to explore where this is coming from.
You need to understand churn rate to explore why customers are leaving. A high churn rate is recognised as a problem for SaaS businesses, with the average monthly churn rate for a SaaS company sitting at 3-8%, and the average annual churn rate at 32-50%
When digging into the details of why customers churn look into the personas, industry and any unique use cases so you can get a sense of why they failed to renew - analysing this data is as important as acquiring it.
It’s also important to share this information with all relevant departments, like marketing and customer success.
Customer Acquisition Cost (CAC) takes account of all the sales and marketing costs required to bring that customer through the pipeline, showing exactly how much it costs to acquire the customer.
This is usually combined with the below metric, Customer Lifetime Value (CLV) this metric helps you to assess if your business model is viable.
CAC is calculated by dividing your total sales and marketing spending, including salaries, by the total number of new customers added in a specific period. For instance, if you spent $50,000 in a month and you added $50 new customers your CAC would be $500.
As a calculation, this looks like this:
CAC = total cost of sales and marketing / # new customers
Investors tend to favour companies with a lower CAC rate as it demonstrates efficiency in sales and marketing spend, so this is a metric worth keeping an eye on.
CLV refers to the average amount customers spend during the time they are at your company, their ‘lifetime’. This figure provides companies with an accurate portrayal of their growth and is calculated by the following:
CLV = (1/churn rate) x average revenue per account (ARPA)
You can calculate ARPA by dividing your total revenue by your total number of customers. CLV gives you a more accurate estimate of revenue potential than CAC can, though these two figures should always be in conversation with one another.
For startups, CLV displays the value of your company to investors. As most SaaS companies are subscription-based, each account renewal adds another year of recurring revenue, increasing the lifetime value per customer.
Conversion rate can tell a go-to-market team exactly where they need to improve. It can be a specific measurement from a particular campaign by marketing or initiative to move people down the pipeline, or a general conversion rate of qualified leads to customers.
For example, if you offer a trial for your product, the conversion rate could apply specifically to how many trial users convert and buy a subscription. It can be calculated like this:
Conversion rate = monthly number of trial users / monthly number of new subscribers
A good conversion rate for this scenario would be around 25 per cent, according to Userpilot. If conversion rates are lower than expected, it could be worth diving into the customer journey and looking at trail feedback to determine if your sales tactics are working.
Your conversion rate is a good indicator of how well both sales and marketing teams are working, and how they optimize this conversion rate. Low conversion should be actively targeted as a point of improvement, while high conversion may show you you’re on the right track.
ACV, which is also known as Average Deal Size, is the average amount of money a business acres per deal it closes. Here is the standard formula for a single contract:
ACV = Total contract value ÷ Number of years
For example, if a customer signs a two-year annual subscription contract with the total value of the contract at $1000, their ACV would be $500.
This can get slightly more complicated when dealing with multiple contracts, as the calculation will look like this:
Average ACV = Total ACV of contracts ÷ Number of contracts
ACV is usually used to measure the revenue of a single subscription-based contract and is calculated in an average dollar amount, standardized across one year. ACV is useful for sales teams on multiple fronts:
For sales, ACV can help you calculate the average, standardized revenue value of every contract you gain in a set period.
This metric focuses on the collaboration between sales and marketing teams - which is not to be underestimated.
If you don’t know how many leads it takes to close a deal or which leads are closing, for that matter, you’ll struggle to be successful. This metric takes into account not only your sales team's ability to close but also the marketing team’s ability to generate qualified leads. As a calculation, this looks like:
Lead to close rate = (Number of deals closed ÷ number of lead opportunities given during a set timeframe) x 100
This metric is only comparable to your industry and business, as there is no gold standard for an ideal close rate every business should be aiming for. The average is around 20 per cent, but again, this depends entirely on the industry you work in.
Keep an eye on this metric to ensure that you’re striking the right balance with your sales and marketing alignment.
People don't talk about this metric as frequently, perhaps because it doesn’t have a solid acronym! However, looking at how many meetings you have booked is extremely helpful for those looking at total pipeline value.
There is no calculation needed for this metric as you simply need to look at the number of meetings booked by Sales Development Representatives in a given timeframe.
The funnel between meetings booked, MRR and pipeline value is key as it enables you to identify gaps. These could be in your qualification process, lead quality or poor pipeline management; whatever it is, you can't manage what you can't measure
This metric can also help sales teams gauge how effective their outreach efforts are in securing meetings.
LVR refers to the growth percentage of qualified leads month over month, effectively measuring your pipeline development.
In actuality, it measures how many potential customers you’re currently trying to convert to actual customers. As a calculation in per cent, this looks like:
LVR (%) = (Qualified leads current month - qualified leads last month) ÷ qualified leads last month (x 100)
This measure is a helpful leading indicator of sales revenue, as while actual revenue may fluctuate, a steady increase in the number of qualified leads is a reliable predictor of future revenue growth. It is a real-time indicator of growth, in contrast to MRR which is known to be a lagging indicator.
Although, this metric does come with the warning that it’s not actual revenue. So if there is a lag in the sales process, this metric will become unreliable.
Do you find that your sales process is slowed down by the time it takes for your sales team to complete all the contract admin needed to close a deal?
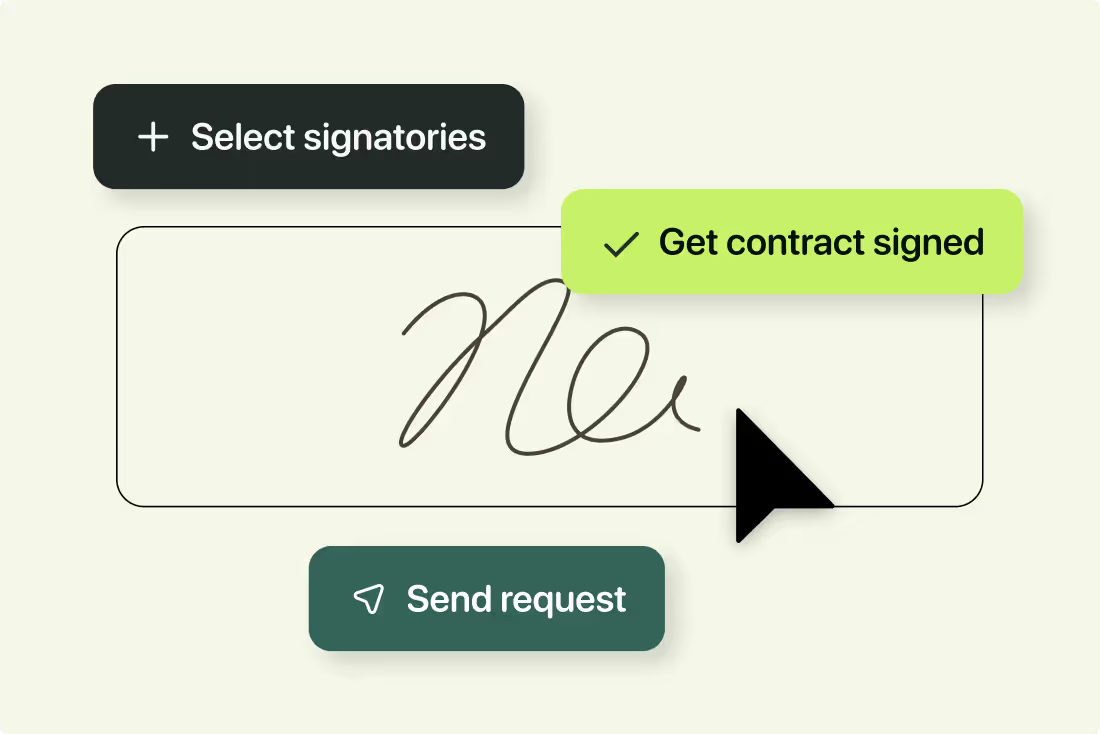
Time to sign is not a traditional sales metric, but it is an important one. Don’t let contract admin become a revenue blocker. If it is, it could be time to consider using a Contract Lifecycle Management (CLM) tool like Juro.
This could reduce your time to sign by 30%, as sales teams can:
Sound good? Book a demo with Juro by filling in the form below. You'll get to speak to one of our specialists and see Juro in action.
For SaaS contract templates, check out the ones below:

Lorem ipsum dolor sit amet, consectetur adipiscing elit. Suspendisse varius enim in eros elementum tristique. Duis cursus, mi quis viverra ornare, eros dolor interdum nulla, ut commodo diam libero vitae erat. Aenean faucibus nibh et justo cursus id rutrum lorem imperdiet. Nunc ut sem vitae risus tristique posuere.
Hello. We are Juro Online Limited (known by humans as Juro). Here's a summary of how we protect your data and respect your privacy.